ANALYSING THE THROW-IN
by John Bilton
This analysis is about measuring the team’s ability to enter the attacking third in possession from the throw-in. Elite1 teams will exhibit a ‘Performance Standard’ of 35% minimum for their conversion of throw-ins into attacking third possession entries (A3P’s). Average1 teams will be at 20% or less. Teams
who are technically and tactically able have been shown to produce an extra 16 attacking third possession entries from throw-ins. A team's data becomes more reliable over a number of matches as trends start to appear since average teams may deliver an elite performance as a one off occurrence. This example is from a one match performance yet it is still very meaningful.
The article also includes information re utilizing Nacsport’s new XLS Format 3 output.
One of the most useful and powerful new tools that came with the 2.3.5 January 2017 update release is the ability to output XLS data in a preset order
format 3 (+V). Basically all the data from the analysis is placed in defined columns on the spread sheet. This allows for the presentation of “stats” to
coaches and players in a powerful way.
The methodology, including gathering, manipulating, presenting and suggested implications for coaching are shown in this example of analysing throw-
ins. The match chosen is the England v Scotland World Cup Qualifier on 11th November 2016, this is just one example from the match
We will start at the end of the analysis process with suggested presentation types for coaches and players followed by information for analysts and conclude with some implications for coaching.
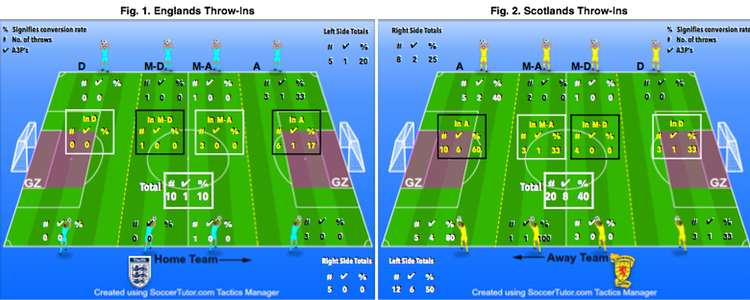
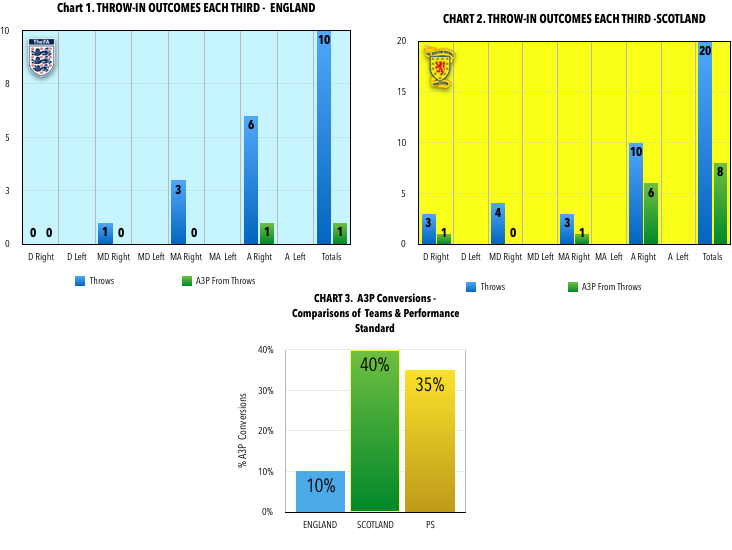
The figures 1 and 2 show the number of throws-ins for each third on both the right and left sides. Note the middle third is split into a middle defending (M-D) and middle attacking (M-A) zone. The tables in the line of boxes across the field show the totals for each third and the centre white box shows the grand totals. To cater for the coaches and players possible different learning styles a bar chart is also shown in charts 1, 2 and 3.
Major Findings
- England had 10 throws in total and produced just the one A3P, a 10% conversion rate. Scotland produced a 40% conversion rate from double the England throws. They exceeded the PS of 37% and gained an extra 8 A3P’s from their throws.
- England need to consider their performance in their opponents half (M-A & A) by studying the video evidence and planning from there.
- Scotland’s more productive side of the field was the left with a conversion rate of 83%
- Scotland need to consider their throw-in performance in the middle third. (M-A & M-D)
- Conversely England need to examine their defending at throw-ins particularly down their right side.
- England only took 10 throw-ins, consequently consideration needs to be given to possibly press their opponents more down the line in the relevant areas in order to gain more throws in M-A & A and then use the throw to gain a possession entry into A (A3P).
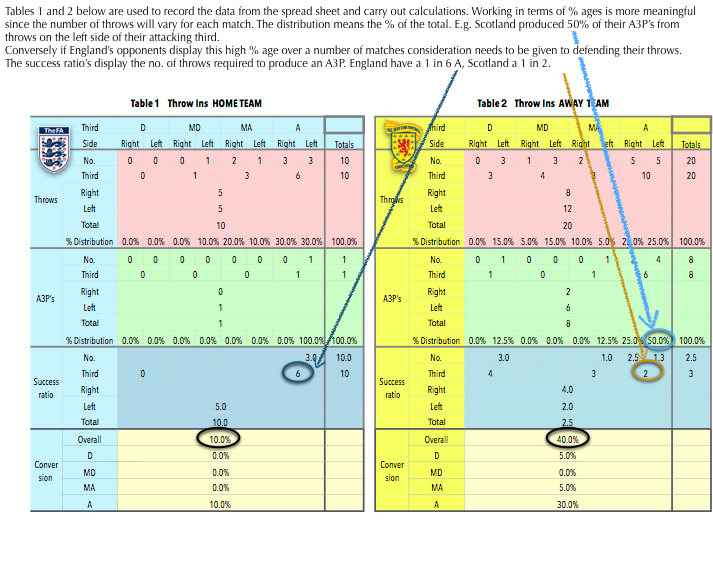
- In order to simplify this example, the outcome of the A3P entries from the throws have not been included. This is obviously important to factor in. From their 8 successful throws, Scotland achieved 1 strike on target, 1 corner, 2 further throws and a left sided un-productive cross. England produced an un-productive cross from their 1 successful throw.
1 Appendix 1 describes the difference between elite and average teams.
ATTACKING THIRD THROW CRITERIA
- An A3P throw-in created in the attacking third (A) is classified as a conversion when:
- The team keep possession for a minimum of 3 passes, not including the throw.
- An attempt is made to deliver the ball into GZ or take a strike.
- A long throw creates a possession delivery into GZ and or a strike
 XLS Format 3 Output Data
The XLS Format 3 information in spread sheet format may interest some coaches in addition to the figures and charts. It may open up a loop to thinking about other areas that he/she needs to know.
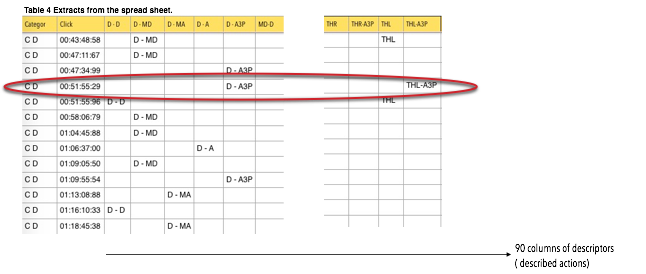
Table 4 below (taken from the Numbers App.) shows the designated columns relative to this example. In this template there are 90 columns. 30 are taken for each player since some of their individual actions are monitored.
You can set the spread sheet column order of the template’s descriptors by allocating them a fixed column. This is then specific to this template. Dragging the descriptors into order working from left to right in the Matrix pre-orders them in the spread sheet.
Each row represents a new ball possession for either of the two teams. Consequently we have the data for every sequential possession that occurs in the match. If you total the contents of each column you get the data in pockets e.g. passes, crosses, strikes etc. However if the analysis is to be truly meaningful in relation to using the data sequentially for each possession we need to code, group, calculate and analyse data for every team possession which occurs in the match.
The COUNTIFS formula is used to test for a specified number of descriptor occurrences.
The circled row indicates that the team started a possession in the defending third (C D) on 51:55 minutes. D-A3P indicates that the possession was started in D and finished in the attacking third with a possession. THL-AP3 indicates that the throw was taken on the left side (THL), and started the possession and it resulted in an A3P. So to test for this scenario the COUNTIFS formula is used to test for a specified number of descriptor occurrences. The formula will count a 1 occurrence IF there is a possession gain in D that results in a successful left sided throw in the attacking third THL-A3P.
To Conclude, how may we use the evidence/‘stats’ in this “evidence based coaching” approach? What are the implications for coaching that may guide the coaches and players to bring about a performance improvement in pursuit of attaining the PS. Or if we have reached the PS how higher do we raise the bar to challenge the coach and players to be accountable and responsible for the team’s performance?
Implications For Coaching
1. When taking a throw-in a team has basically two options. Throw the ball into the congested throw-in zone and continue to try to play from there, or throw the ball in such a way that provides an opportunity to change the direction (DC) of play away from the throw-in zone.
2 From our analysis of throw-ins in the 2014 World Cup, Germany’s data from the final tells us what’s possible when there is a direction change from the throw-in. Teams with a tactical strategy and the technical ability to change the direction of play after the throw into areas where players have more time and space may gain an extra 16+ A3P’s from around 30 throws ( 53% conversion rate.)
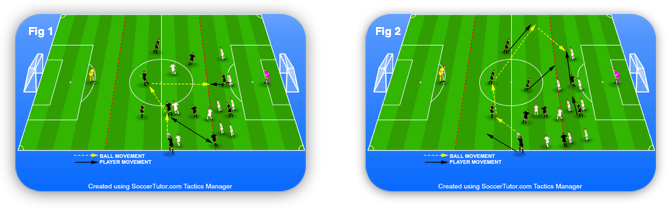
3 Plan short throws to create an opportunity to come out of the throw-in area and attack through the central attacking zone. Shown started with a cross over. ( Figure 1)
4 Plan short throws to create an opportunity to come out of the throw-in area, switch play and create an opportunity to enter the attacking third with possession on the opposite side of the pitch. (Figure 2 and Video 3 below)
5 Plan throws to create possession entries into the scoring zone (Gold Zone) Video 1& 2 Below.
6 Long throws can be very wasteful, meticulous planning is required to produce a strike.
7 Monitor the sequential outcome of a throw, delivery type into the Gold Zone, possession, strike outcomes and also strikes outside the Gold Zone.
8 Time spent on the training ground with throw-ins may result in an extra 16 attacking third entries, these are 'major' not marginal gains.
9 For those developing young players, have the belief that every throw-in is an opportunity to develop the players technical and tactical ability and not merely a means of getting the ball back into play.
Video 1 Plan throws to create possession entries into the scoring zone (Gold Zone) with a Box Pass (BP) - EPL Stoke City v West Ham United
Video 2. Plan throws to create possession entries into the scoring zone (Gold Zone) with a Box Pass (BP) - U18 Academy Friendly Blackburn Rovers v Chesterfield
Video 3 Plan to switch play from the throw-in area, and a goal scored by a Box Pass (BP)- U17 Academy match Fenerbahce v Galatasaray
Appendix 1 Average and Elite
For the past 7 years a colleague and I Dr. Peter Usher, have been investigating a central theme - The Probability of Winning - with the view to establishing ‘Performance Standards’ (PS’s) which coaches can use to guide them from “Stats to Training Ground” in an Evidence Based Coaching structure. Data has been collected from over 1000 matches and 8600 goals (not all related) and the analysis process of where and how those goals are scored has revealed significant patterns for optimal locations for goal-scoring strikes and the delivery of the ball into that optimal goal-scoring zone. Matches at all levels of the game have been analysed, pro to youth male and female. World Cups, UEFA Championships, UEFA Champions League, top leagues in Europe, the English Football League and academy matches in Turkey (U14 to U21) and U18 academy matches in England.
The data patterns reveal distinct differences between teams which score 0, 1, 2 or 3+ goals. As should be expected, teams which score 3+ goals, and increase their probability of winning, are far more efficient and accurate in striking for goal. They attempt more strikes from inside the optimal goal scoring zone, are more accurate in delivering the ball into the optimal goal-scoring zone, transfer more of their possessions into the attacking third and, once there, have a higher pass accuracy than teams scoring less than three goals. This 3+ goals performance is classified as an elite performance. Coaches working with players, teams and programmes should plan and work to be more than average, elitism must be the objective.
Performance standards (PS). The advantage being.
- PS’s provide coaches & players with specific performance expectations.
- They are observable behaviours and actions which explain how the game is to be played, and the performance required for high-performance football.
- They tell individual players, the team and the coach, what a good performance looks like and wether it is acceptable.
- They develop the club/organisation's values, beliefs and philosophy
- They develop Accountability & Responsibility (A & R) with both coaches & players
- They set a Culture of A & R.